The graph shown displays the market for loanable funds in an economy. 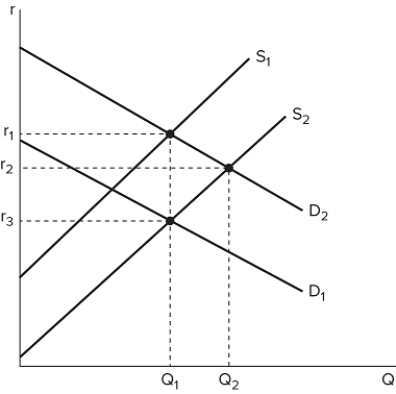 Suppose investors become more optimistic that the economy will do well over the next decade. How will the market for loanable funds be affected?
A) Supply will shift to the right, from S1 to S2
B) Supply will shift to the left, from S2 to S1
C) Demand will shift to the right, from D1 to D2
D) Demand will shift to the left, from D2 to D1
Correct Answer:
Verified
Q43: The principal of a loan is the:
A)
Q44: If Riko takes out a one-year loan
Q45: If Howard takes out a one-year loan
Q46: If citizens expect to bear most of
Q47: The graph shown displays the market for
Q49: After taking out a one-year loan with
Q50: If the rate of return is lower
Q51: In the market for loanable funds, the
Q52: In the market for loanable funds, the
Q53: If the rate of return is higher
Unlock this Answer For Free Now!
View this answer and more for free by performing one of the following actions

Scan the QR code to install the App and get 2 free unlocks

Unlock quizzes for free by uploading documents