The figure shown displays various economic outcomes. 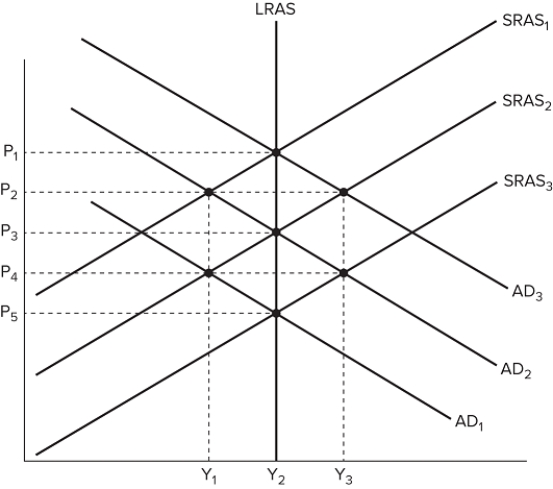 If the aggregate demand curve shifts from AD2 to AD3, the resulting price and output in the long run would be:
A) P 1 and Y 2.
B) P 2 and Y 2.
C) P 1 and Y 1.
D) P 4 and Y 2.
Correct Answer:
Verified
Q127: The figure shown displays various economic outcomes.
Q128: The figure shown displays various economic outcomes.
Q129: A situation in which output decreases while
Q130: A year-long drought that destroys most of
Q131: If the aggregate demand curve shifts to
Q133: Demand-side shifts change:
A) the price level in
Q134: If the aggregate demand curve shifts, moving
Q135: Assuming an economy starts in long-run equilibrium,
Q136: During the 1970s, the U.S. economy experienced
Q137: The figure shown displays various economic outcomes.
Unlock this Answer For Free Now!
View this answer and more for free by performing one of the following actions

Scan the QR code to install the App and get 2 free unlocks

Unlock quizzes for free by uploading documents