The figure shows planned aggregate expenditure and output for an economy. 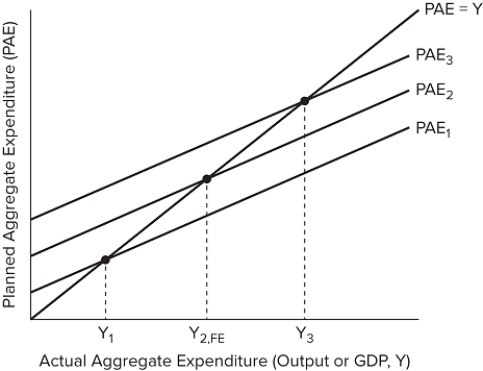 The distance between _______ illustrates an inflationary expenditure gap.
A) PAE 2 and PAE 3
B) PAE 1 and PAE 2
C) Y 1 and Y 2
D) Y 2 and Y 3
Correct Answer:
Verified
Q102: If the MPC is 0.8, what must
Q103: The spending multiplier grows _ as the
Q104: The spending multiplier tells us the amount
Q105: The figure shows planned aggregate expenditure and
Q106: If the MPC were to increase from
Q108: If spending increases by $100, and GDP
Q109: The multiplier effect suggests that:
A) a ripple
Q110: In order to accurately capture the multiplier
Q111: The multiplier effect occurs when:
A) spending by
Q112: The multiplier measures the:
A) effect of government
Unlock this Answer For Free Now!
View this answer and more for free by performing one of the following actions

Scan the QR code to install the App and get 2 free unlocks

Unlock quizzes for free by uploading documents