Consider the thermoacidophile, Sulfolobus acidocaldarius. Which of the following graphs most accurately depicts the expected temperature and pH profiles of its enzymes? (Note: The horizontal axes of these graphs are double, with pH above and temperature below.) 
A) 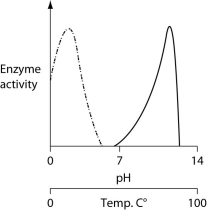
B) 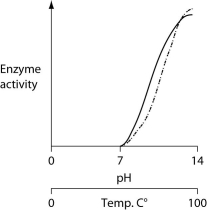
C) 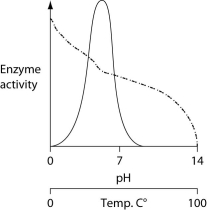
D) 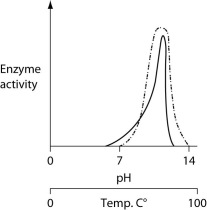
Correct Answer:
Verified
Q44: Use the information in the following paragraph
Q45: Use the information in the following paragraph
Q46: During which two times can the recipient
Q47: The following questions refer to Figure 27.1.
In
Q48: Use the information in the following paragraph
Q50: The following questions refer to Figure 27.1.
In
Q51: Which question, arising from the results depicted
Q52: Figure 27.2 depicts changes to the amount
Q53: Use the information in the following paragraph
Q54: Use the information in the following paragraph
Unlock this Answer For Free Now!
View this answer and more for free by performing one of the following actions

Scan the QR code to install the App and get 2 free unlocks

Unlock quizzes for free by uploading documents