Figure 37.1 shows the results of a study to determine the effect of soil air spaces on plant growth.
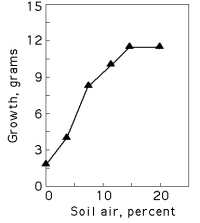
Figure 37.1
-The best explanation for the shape of the growth response curve in Figure 37.1 is that
A) the plant requires air in the soil for photosynthesis.
B) the roots are able to absorb more nitrogen (N₂) in high levels of air.
C) most of the decrease in weight at low air levels is due to transpiration from the leaves.
D) increased soil air produces more root mass in the soil but does not affect the top stems and leaves.
E) the roots require oxygen for respiration and growth.
Correct Answer:
Verified
Q64: Figure 37.1 shows the results of a
Q65: Which soil type or habitat would be
Q66: Epiphytes are
A) fungi that attack plants.
B) fungi
Q67: What are epiphytes?
A) aerial vines common in
Q68: Most of the mass of organic material
Q70: Rhizobia and mycorrhizae share all of the
Q71: Rhizobia, actinomycetes, and cyanobacteria all share the
Q72: A greenhouse experiment to test growth rates
Q73: You are conducting an experiment on plant
Q74: Some of the problems associated with intensive
Unlock this Answer For Free Now!
View this answer and more for free by performing one of the following actions

Scan the QR code to install the App and get 2 free unlocks

Unlock quizzes for free by uploading documents