In the following figure, the total willingness to pay for the 10th unit of the good is _______.
A) $12
B) $20
C) $160
D) $200 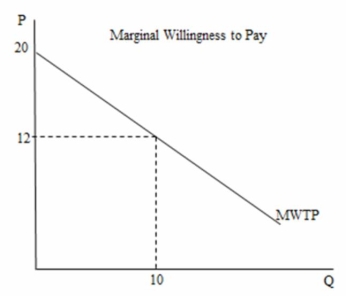
Correct Answer:
Verified
Q8: The notion of diminishing willingness to pay
Q9: Willingness to pay is graphed _.
A) as
Q10: The following figure shows the impact of
Q11: Total willingness to pay _.
A) is the
Q12: Opportunity cost _.
A) is represented by the
Q14: Aggregate demand curves are _.
A) not of
Q15: The marginal cost curve is affected by
Q16: In the following figure the marginal cost
Q17: The following figure shows the impact of
Q18: All of the following are difficulties with
Unlock this Answer For Free Now!
View this answer and more for free by performing one of the following actions

Scan the QR code to install the App and get 2 free unlocks

Unlock quizzes for free by uploading documents