The following figure shows the impact of technological change on the marginal cost of producing a certain good. Producing Q* units with the new technology reduces total cost by an amount equal to ________.
A) area a
B) area b
C) area c
D) areas a + b 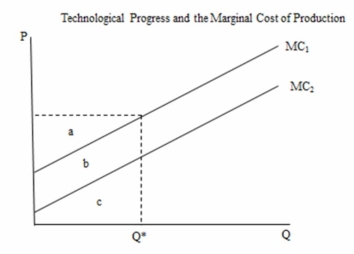
Correct Answer:
Verified
Q5: Private costs are _, while social costs
Q6: The value of a good or service
Q7: One criterion for evaluating environmental policies is
Q8: The notion of diminishing willingness to pay
Q9: Willingness to pay is graphed _.
A) as
Q11: Total willingness to pay _.
A) is the
Q12: Opportunity cost _.
A) is represented by the
Q13: In the following figure, the total willingness
Q14: Aggregate demand curves are _.
A) not of
Q15: The marginal cost curve is affected by
Unlock this Answer For Free Now!
View this answer and more for free by performing one of the following actions

Scan the QR code to install the App and get 2 free unlocks

Unlock quizzes for free by uploading documents