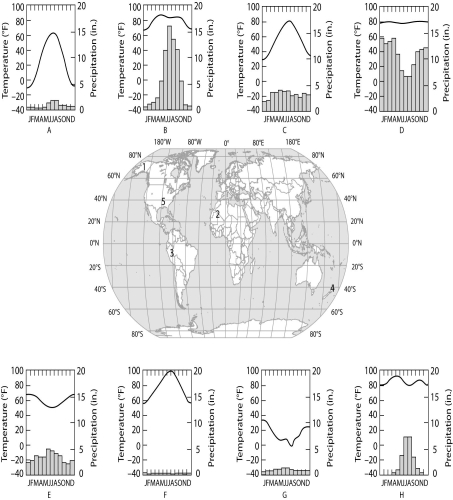
The eight climographs below show yearly temperature (line graph and left vertical axis) and precipitation (bar graph and right vertical axis) averages for each month for some locations on Earth. Choose the climograph that best answers the question or completes the statement. Climographs may be used once, more than once, or not at all.

-Which climograph shows the climate for location 4?
A) A
B) B
C) C
D) E
E) G
Correct Answer:
Verified
Q38: Imagine that a deep temperate zone lake
Q39: Which of the following statements best describes
Q40: Coral reefs can be found on the
Q41: The diagram shows a generalized cross section
Q42: The eight climographs below show yearly temperature
Q44: In the development of terrestrial biomes, which
Q45: The diagram shows a generalized cross section
Q46: Studying species transplants is a way that
Q47: Trees are not usually found in the
Q48: The diagram shows a generalized cross section
Unlock this Answer For Free Now!
View this answer and more for free by performing one of the following actions

Scan the QR code to install the App and get 2 free unlocks

Unlock quizzes for free by uploading documents