Short Answer
Which of the following contour diagrams is more likely to show the population density of a region of a small town where the center of the diagram is the town center?
I.  II.
II. 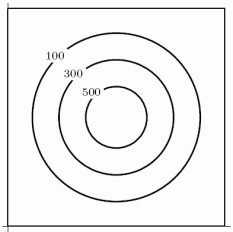
Correct Answer:
Verified
Related Questions
Q123: The number, N, of children that can
Q124: If Q125: The monthly car payment for a new![]()

