Suppose that the distribution of people's ages in the United States is essentially constant, or uniform, from age 0 to age 60, and from there it decreases linearly until age 100. This distribution p(x) is shown below, where x is age in years, and p measures probability density. Such a probability distribution is called trapezoidal. 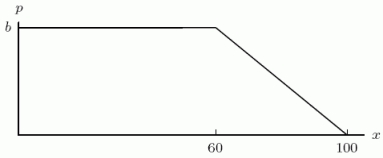 In terms of b (see the graph) , find the fraction of the population that is between 60 and 100 years old.
A) 60b
B) 20b
C) 40b
D) 80b
Correct Answer:
Verified
Q2: A density function for the age of
Q3: The distribution of heights, x, in meters,
Q4: The following figure gives the density function
Q5: Which of the following could possibly be
Q6: The following figure gives the density function
Q8: An aptitude test is given to a
Q9: A professor far away from here gives
Q10: The following figure gives the density function
Q11: Suppose Q12: The density function f(x) shown below describes![]()
Unlock this Answer For Free Now!
View this answer and more for free by performing one of the following actions

Scan the QR code to install the App and get 2 free unlocks

Unlock quizzes for free by uploading documents