Multiple Choice
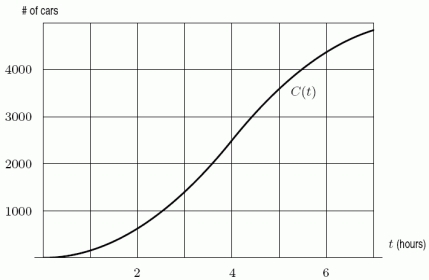
To study traffic flow along a major road, the city installs a device at the edge of the road at 4:00 am. The device counts the cars driving past, and records the total periodically. The resulting data is plotted on a graph, with time (in hours) on the horizontal axis and the number of cars on the vertical axis. The graph is shown below. It is a graph of the function  = Total number of cars that have passed by after t hours. Estimate
  .
. 
A) 1000
B) 1300
C) 1600
D) 1900
Correct Answer:
Verified
Related Questions
Q44: The following table gives the wind chill

