Multiple Choice
The graph of  is shown in the following figure. Is
  positive, negative, or zero?
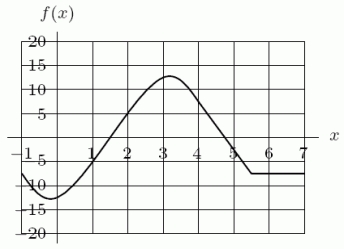
A) zero
B) positive
C) negative
Correct Answer:
Verified
Related Questions
Q50: Every day the Undergraduate Office of Admissions
Q51: Let Q52: The population of a certain town is Q53: The following table shows the number of Q54: The noise level, N, in decibels, of Q56: The noise level, N, in decibels, of Q57: Let Q58: The cost of extracting T tons of Q59: The graph of Q60: The cost of extracting T tons of Unlock this Answer For Free Now! View this answer and more for free by performing one of the following actions Scan the QR code to install the App and get 2 free unlocks Unlock quizzes for free by uploading documents![]()
![]()
![]()

