Multiple Choice
The following figure shows the demand and supply curves for a product. Estimate the equilibrium quantity. 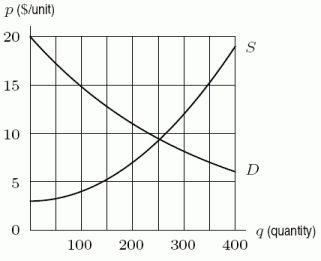
A) 0
B) 140
C) 250
D) 400
Correct Answer:
Verified
Related Questions
Q48: Fuel pressure in the fuel tanks of
Q49: Evaluate Q50: Find Q51: The following figure shows the demand and Q52: If Q54: At time t hours after taking medication, Q55: Supply and demand curves for a product Q56: A. Use the Fundamental Theorem to find Q57: The following figure shows the demand and Q58: If Unlock this Answer For Free Now! View this answer and more for free by performing one of the following actions Scan the QR code to install the App and get 2 free unlocks Unlock quizzes for free by uploading documents![]()
![]()
![]()
![]()

