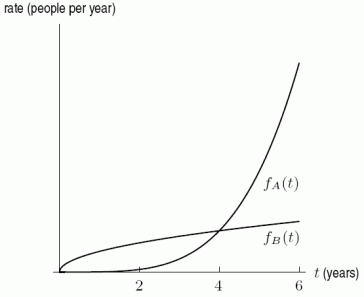
The following figure shows the rate of growth of two cities, with  being the growth of City A after t years and
  being the growth of City B after t years. If the two cities have the same population at t = 0, arrange the following values in order from smallest to largest by placing a "1" by the smallest, a "2" by the next smallest, and so forth.
A.  B.
B.  C.
C.  D.
D. 
Correct Answer:
Verified
...
View Answer
Unlock this answer now
Get Access to more Verified Answers free of charge
Q77: The marginal cost function of producing a
Q78: Suppose Q79: Water is flowing into a container at Q80: Use the following figure to find the Q81: If Q83: Data for a function G is given Q84: Data for a function G is given Q85: An air conditioning unit is switched on Unlock this Answer For Free Now! View this answer and more for free by performing one of the following actions Scan the QR code to install the App and get 2 free unlocks Unlock quizzes for free by uploading documents![]()
![]()

