The graph below shows how the force on a 0.500 kg particle varies with position. If the particle has speed  at x = 0.00 m, what is its speed in m/s when x = 8.00 m?
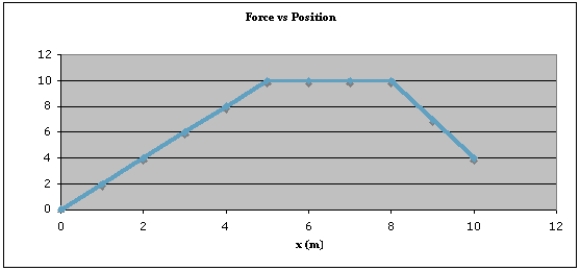
A) 2.00
B) 10.7
C) 14.8
D) 15.0
E) 21.1
Correct Answer:
Verified
Q60: When a crate of mass m is
Q61: A particle is subject to the potential
Q62: The equation below is the solution to
Q63: Positive work can be done
A) by friction
Q64: The force of static friction exerted on
Q66: Two identical springs with spring constant 50
Q67: A moving particle is subject to conservative
Q68: Each of two vectors, Q69: A conservative force on a particle moving Q70: After a skydiver reaches terminal velocity,![]()
A) the
Unlock this Answer For Free Now!
View this answer and more for free by performing one of the following actions

Scan the QR code to install the App and get 2 free unlocks

Unlock quizzes for free by uploading documents