TABLE 2-4
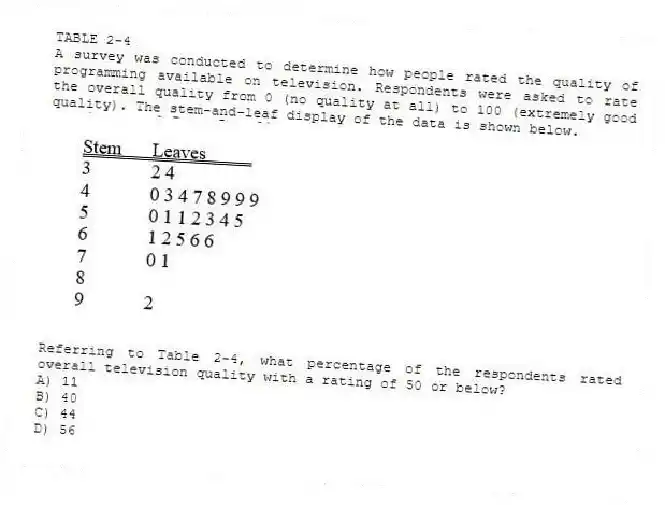
A survey was conducted to determine how people rated the quality of programming available on television. Respondents were asked to rate the overall quality from 0 (no quality at all) to 100 (extremely good quality) . The stem-and-leaf display of the data is shown below.
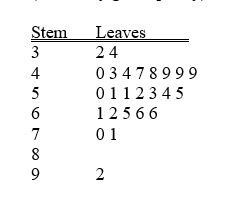
-Referring to Table 2-4, what percentage of the respondents rated overall television quality with a rating of 50 or below?
A) 11
B) 40
C) 44
D) 56
Correct Answer:
Verified
Q30: TABLE 2-5
The following are the duration in
Q32: Which of the following is appropriate for
Q33: Data on the number of credit hours
Q34: You have collected information on the market
Q34: When studying the simultaneous responses to two
Q37: TABLE 2-5
The following are the duration in
Q38: TABLE 2-5
The following are the duration in
Q39: A survey of 150 executives were asked
Q39: TABLE 2-5
The following are the duration in
Q40: TABLE 2-5
The following are the duration in
Unlock this Answer For Free Now!
View this answer and more for free by performing one of the following actions

Scan the QR code to install the App and get 2 free unlocks

Unlock quizzes for free by uploading documents