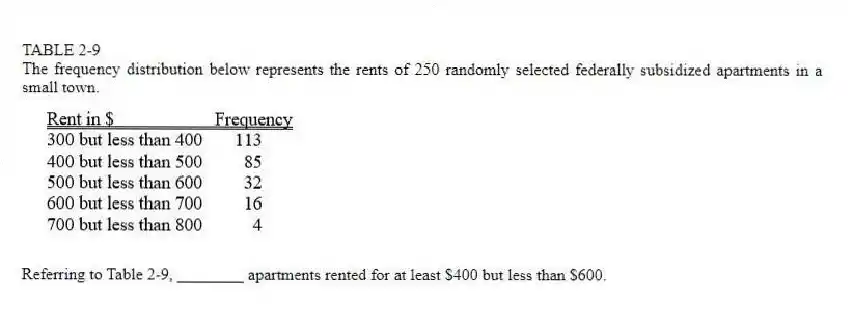
TABLE 2-9
The frequency distribution below represents the rents of 250 randomly selected federally subsidized apartments in a small town.
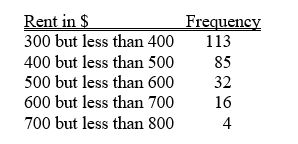
-Referring to Table 2-9, ________ apartments rented for at least $400 but less than $600.
Correct Answer:
Verified
Q60: You have collected data on the number
Q61: TABLE 2-9
The frequency distribution below represents the
Q62: TABLE 2-8
The Stem-and-Leaf display represents the number
Q63: TABLE 2-7
The Stem-and-Leaf display below contains data
Q64: TABLE 2-8
The Stem-and-Leaf display represents the number
Q66: TABLE 2-7
The Stem-and-Leaf display below contains data
Q67: TABLE 2-8
The Stem-and-Leaf display represents the number
Q68: TABLE 2-10
The histogram below represents scores achieved
Q69: TABLE 2-8
The Stem-and-Leaf display represents the number
Q70: TABLE 2-8
The Stem-and-Leaf display represents the number
Unlock this Answer For Free Now!
View this answer and more for free by performing one of the following actions

Scan the QR code to install the App and get 2 free unlocks

Unlock quizzes for free by uploading documents