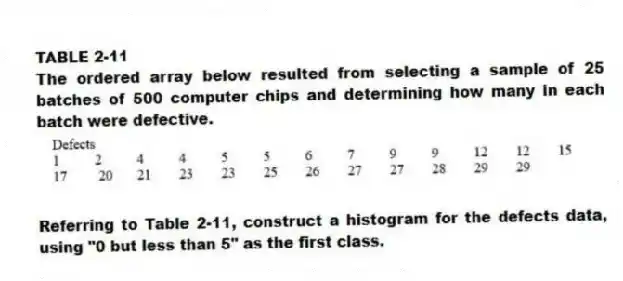
TABLE 2-11
The ordered array below resulted from selecting a sample of 25 batches of 500 computer chips and determining how many in each batch were defective.

-Referring to Table 2-11, construct a histogram for the defects data, using "0 but less than 5" as the first class.
Correct Answer:
Verified
Q82: The point halfway between the boundaries of
Q92: The width of each class grouping or
Q94: TABLE 2-11
The ordered array below resulted from
Q95: TABLE 2-11
The ordered array below resulted from
Q97: TABLE 2-10
The histogram below represents scores achieved
Q98: TABLE 2-10
The histogram below represents scores achieved
Q101: The main principle behind the Pareto chart
Q103: Histograms are used for numerical data while
Q110: Determining the class boundaries of a frequency
Q115: The stem-and-leaf display is often superior to
Unlock this Answer For Free Now!
View this answer and more for free by performing one of the following actions

Scan the QR code to install the App and get 2 free unlocks

Unlock quizzes for free by uploading documents