TABLE 2-13
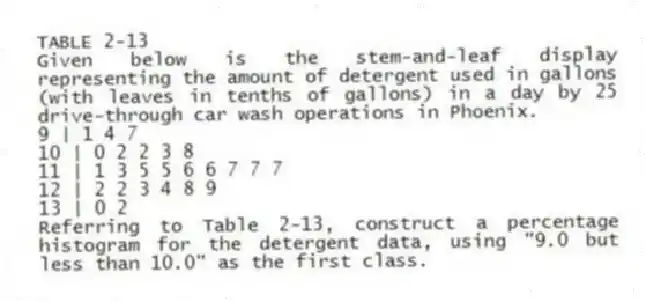
Given below is the stem-and-leaf display representing the amount of detergent used in gallons (with leaves in tenths of gallons) in a day by 25 drive-through car wash operations in Phoenix.
9 | 1 4 7
10 | 0 2 2 3 8
11 | 1 3 5 5 6 6 7 7 7
12 | 2 2 3 4 8 9
13 | 0 2
-Referring to Table 2-13, construct a percentage histogram for the detergent data, using "9.0 but less than 10.0" as the first class.
Correct Answer:
Verified
Q171: TABLE 2-14
The table below contains the number
Q172: TABLE 2-14
The table below contains the number
Q173: TABLE 2-13
Given below is the stem-and-leaf display
Q174: TABLE 2-14
The table below contains the number
Q175: TABLE 2-14
The table below contains the number
Q177: TABLE 2-14
The table below contains the number
Q178: TABLE 2-14
The table below contains the number
Q179: TABLE 2-14
The table below contains the number
Q180: TABLE 2-14
The table below contains the number
Q181: TABLE 2-16
The figure below is the percentage
Unlock this Answer For Free Now!
View this answer and more for free by performing one of the following actions

Scan the QR code to install the App and get 2 free unlocks

Unlock quizzes for free by uploading documents