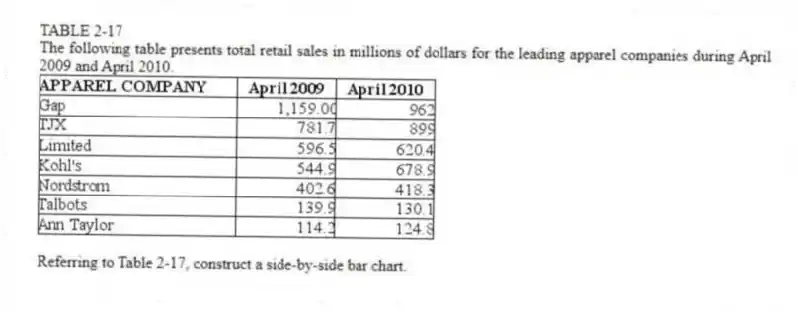
TABLE 2-17
The following table presents total retail sales in millions of dollars for the leading apparel companies during April 2009 and April 2010.
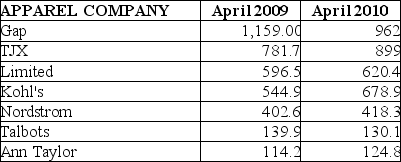
-Referring to Table 2-17, construct a side-by-side bar chart.
Correct Answer:
Verified
Q182: TABLE 2-14
The table below contains the number
Q183: TABLE 2-17
The following table presents total retail
Q184: TABLE 2-15
The figure below is the ogive
Q185: TABLE 2-14
The table below contains the number
Q186: TABLE 2-18
The stem-and-leaf display below shows the
Q188: TABLE 2-17
The following table presents total retail
Q189: TABLE 2-14
The table below contains the number
Q190: TABLE 2-15
The figure below is the ogive
Q191: TABLE 2-17
The following table presents total retail
Q192: TABLE 2-14
The table below contains the number
Unlock this Answer For Free Now!
View this answer and more for free by performing one of the following actions

Scan the QR code to install the App and get 2 free unlocks

Unlock quizzes for free by uploading documents