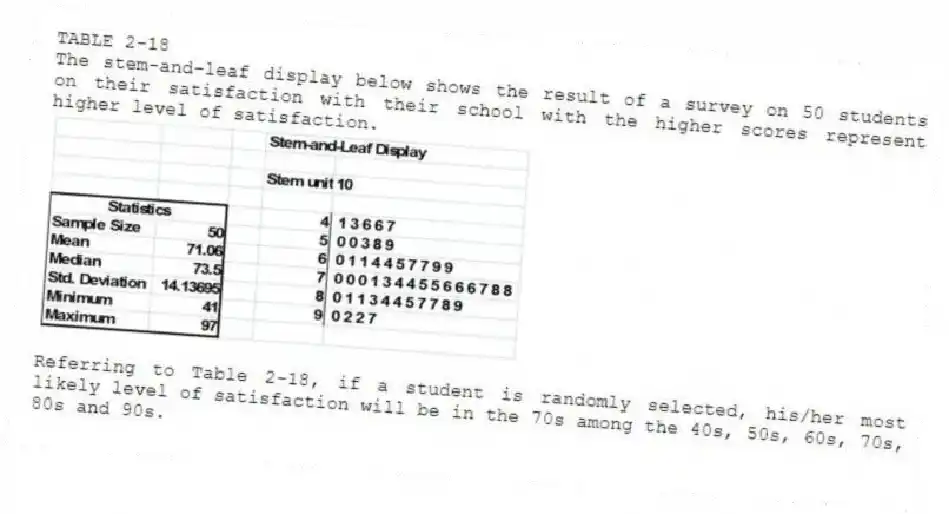
TABLE 2-18
The stem-and-leaf display below shows the result of a survey on 50 students on their satisfaction with their school with the higher scores represent higher level of satisfaction.
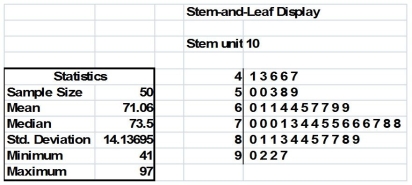
-Referring to Table 2-18, if a student is randomly selected, his/her most likely level of satisfaction will be in the 70s among the 40s, 50s, 60s, 70s, 80s and 90s.
Correct Answer:
Verified
Q196: TABLE 2-14
The table below contains the number
Q197: TABLE 2-18
The stem-and-leaf display below shows the
Q198: TABLE 2-18
The stem-and-leaf display below shows the
Q199: TABLE 2-18
The stem-and-leaf display below shows the
Q200: TABLE 2-15
The figure below is the ogive
Q202: Given below is the scatter plot of
Q203: Given below is the scatter plot of
Q204: Given below is the scatter plot of
Q205: TABLE 2-18
The stem-and-leaf display below shows the
Q206: Given below is the scatter plot of
Unlock this Answer For Free Now!
View this answer and more for free by performing one of the following actions

Scan the QR code to install the App and get 2 free unlocks

Unlock quizzes for free by uploading documents