TABLE 13-1
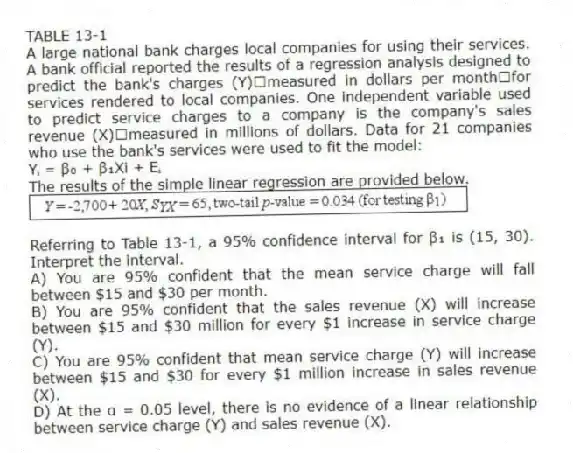
A large national bank charges local companies for using their services. A bank official reported the results of a regression analysis designed to predict the bank's charges (Y) measured in dollars per monthfor services rendered to local companies. One independent variable used to predict service charges to a company is the company's sales revenue (X) measured in millions of dollars. Data for 21 companies who use the bank's services were used to fit the model:
Yᵢ = β₀ + β₁Xi + Eᵢ
The results of the simple linear regression are provided below.

-Referring to Table 13-1, a 95% confidence interval for β₁ is (15, 30) . Interpret the interval.
A) You are 95% confident that the mean service charge will fall between $15 and $30 per month.
B) You are 95% confident that the sales revenue (X) will increase between $15 and $30 million for every $1 increase in service charge (Y) .
C) You are 95% confident that mean service charge (Y) will increase between $15 and $30 for every $1 million increase in sales revenue (X) .
D) At the α = 0.05 level, there is no evidence of a linear relationship between service charge (Y) and sales revenue (X) .
Correct Answer:
Verified
Q10: TABLE 13-2
A candy bar manufacturer is interested
Q11: TABLE 13-2
A candy bar manufacturer is interested
Q12: The Y-intercept (b₀) represents the
A) predicted value
Q13: Referring to Table 13-2, to test that
Q14: TABLE 13-1
A large national bank charges local
Q16: TABLE 13-2
A candy bar manufacturer is interested
Q17: TABLE 13-2
A candy bar manufacturer is interested
Q18: Referring to Table 13-2, what is the
Q19: TABLE 13-2
A candy bar manufacturer is interested
Q20: The slope (b₁) represents
A) predicted value of
Unlock this Answer For Free Now!
View this answer and more for free by performing one of the following actions

Scan the QR code to install the App and get 2 free unlocks

Unlock quizzes for free by uploading documents