TABLE 13-2
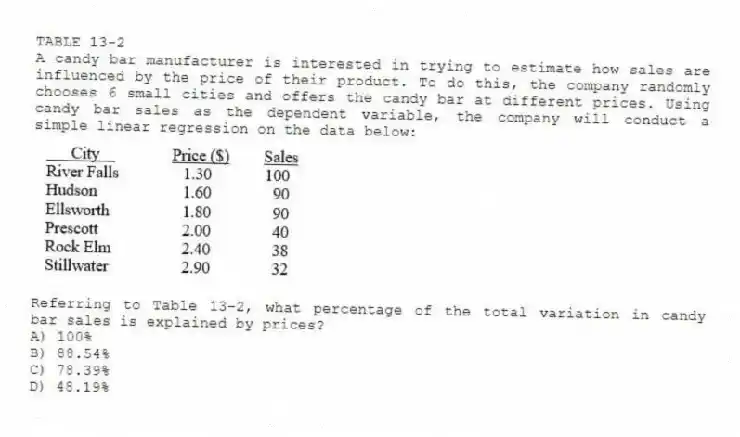
A candy bar manufacturer is interested in trying to estimate how sales are influenced by the price of their product. To do this, the company randomly chooses 6 small cities and offers the candy bar at different prices. Using candy bar sales as the dependent variable, the company will conduct a simple linear regression on the data below: 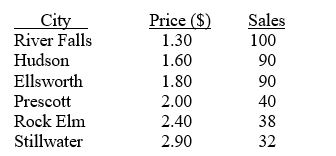
-Referring to Table 13-2, what percentage of the total variation in candy bar sales is explained by prices?
A) 100%
B) 88.54%
C) 78.39%
D) 48.19%
Correct Answer:
Verified
Q1: The Y-intercept (b₀) represents the
A) estimated average
Q3: TABLE 13-1
A large national bank charges local
Q4: Referring to Table 13-2, if the price
Q6: TABLE 13-1
A large national bank charges local
Q7: Referring to Table 13-2, what is
Q8: Referring to Table 13-2, if the price
Q9: Referring to Table 13-2, to test whether
Q10: TABLE 13-2
A candy bar manufacturer is interested
Q11: TABLE 13-2
A candy bar manufacturer is interested
Q20: The least squares method minimizes which of
Unlock this Answer For Free Now!
View this answer and more for free by performing one of the following actions

Scan the QR code to install the App and get 2 free unlocks

Unlock quizzes for free by uploading documents