TABLE 14-9
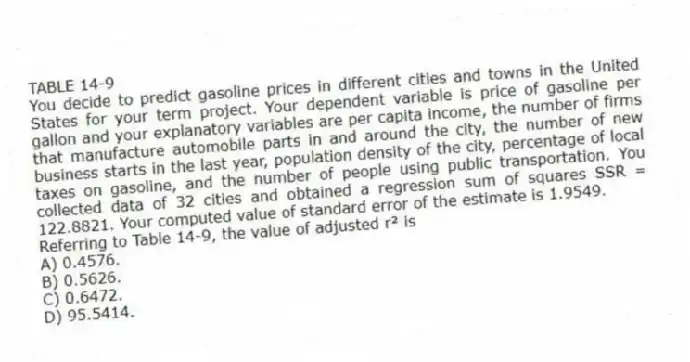
You decide to predict gasoline prices in different cities and towns in the United States for your term project. Your dependent variable is price of gasoline per gallon and your explanatory variables are per capita income, the number of firms that manufacture automobile parts in and around the city, the number of new business starts in the last year, population density of the city, percentage of local taxes on gasoline, and the number of people using public transportation. You collected data of 32 cities and obtained a regression sum of squares SSR = 122.8821. Your computed value of standard error of the estimate is 1.9549.
-Referring to Table 14-9, the value of adjusted r² is
A) 0.4576.
B) 0.5626.
C) 0.6472.
D) 95.5414.
Correct Answer:
Verified
Q127: TABLE 14-8
A financial analyst wanted to examine
Q128: TABLE 14-8
A financial analyst wanted to examine
Q129: TABLE 14-8
A financial analyst wanted to examine
Q130: TABLE 14-10
You worked as an intern at
Q131: TABLE 14-10
You worked as an intern at
Q133: TABLE 14-10
You worked as an intern at
Q134: TABLE 14-10
You worked as an intern at
Q135: TABLE 14-10
You worked as an intern at
Q136: TABLE 14-8
A financial analyst wanted to examine
Q137: TABLE 14-8
A financial analyst wanted to examine
Unlock this Answer For Free Now!
View this answer and more for free by performing one of the following actions

Scan the QR code to install the App and get 2 free unlocks

Unlock quizzes for free by uploading documents