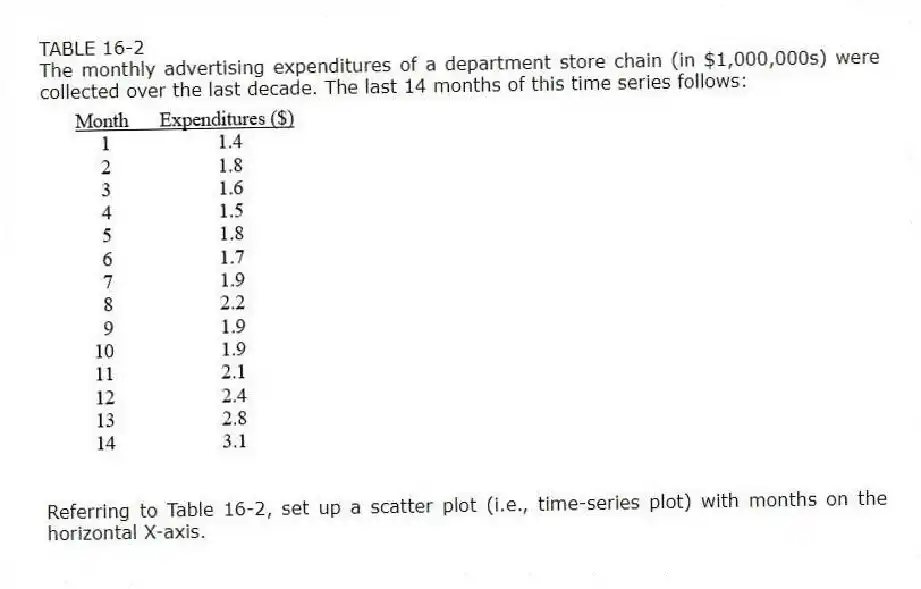
TABLE 16-2
The monthly advertising expenditures of a department store chain (in $1,000,000s) were collected over the last decade. The last 14 months of this time series follows: 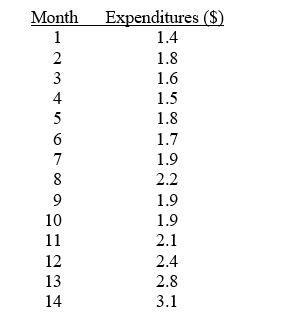
-Referring to Table 16-2, set up a scatter plot (i.e., time-series plot) with months on the horizontal X-axis.
Correct Answer:
Verified
Q37: Which of the following terms describes the
Q51: TABLE 16-4
The number of cases of merlot
Q52: TABLE 16-4
The number of cases of merlot
Q53: TABLE 16-3
The following table contains the number
Q54: TABLE 16-4
The number of cases of merlot
Q55: TABLE 16-3
The following table contains the number
Q57: TABLE 16-2
The monthly advertising expenditures of a
Q58: TABLE 16-3
The following table contains the number
Q60: TABLE 16-3
The following table contains the number
Q61: TABLE 16-4
The number of cases of merlot
Unlock this Answer For Free Now!
View this answer and more for free by performing one of the following actions

Scan the QR code to install the App and get 2 free unlocks

Unlock quizzes for free by uploading documents