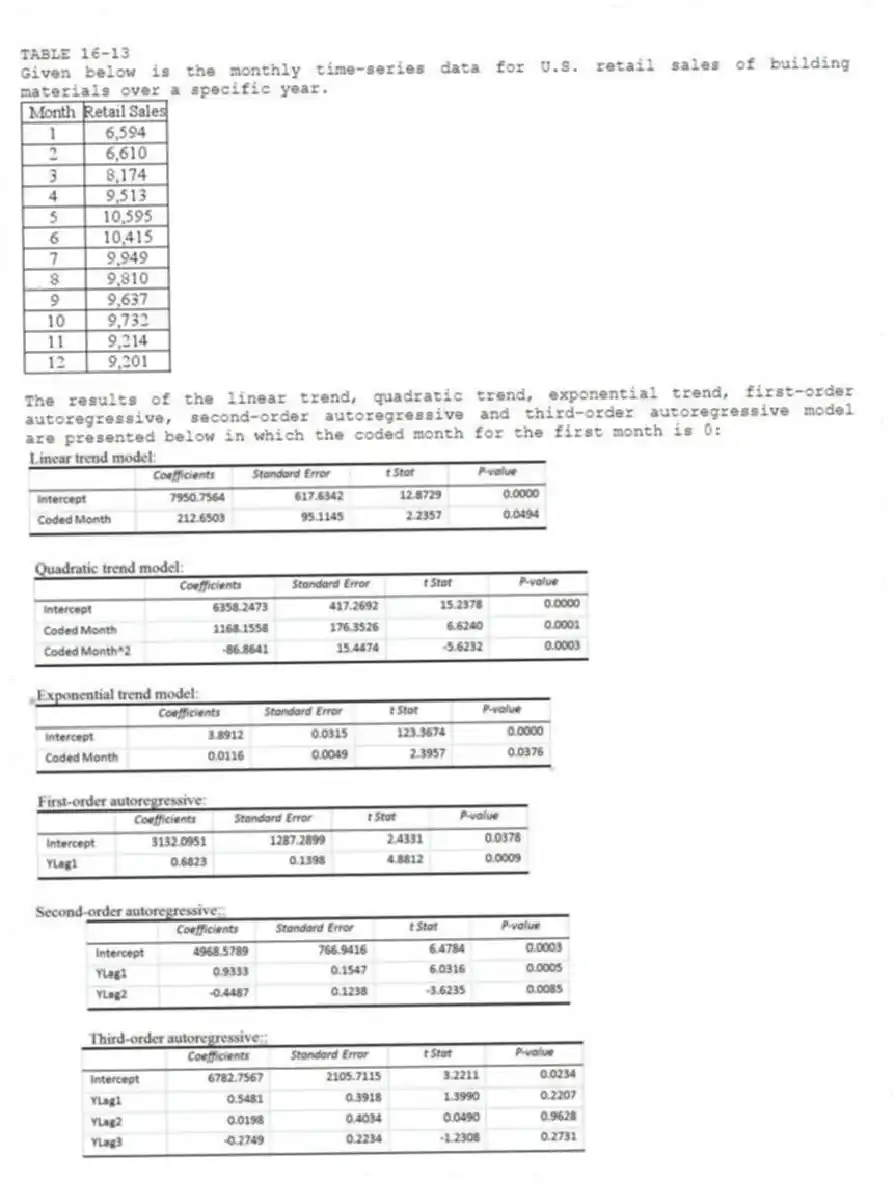
TABLE 16-13
Given below is the monthly time-series data for U.S. retail sales of building materials over a specific year.

The results of the linear trend, quadratic trend, exponential trend, first-order autoregressive, second-order autoregressive and third-order autoregressive model are presented below in which the coded month for the first month is 0:


-Referring to Table 16-13, construct a scatter plot (i.e., a time-series plot) with month on the horizontal X-axis.
Correct Answer:
Verified
Q116: TABLE 16-10
Business closures in Laramie, Wyoming from
Q117: TABLE 16-11
The manager of a health club
Q118: TABLE 16-12
A local store developed a multiplicative
Q119: TABLE 16-11
The manager of a health club
Q120: TABLE 16-12
A local store developed a multiplicative
Q122: TABLE 16-13
Given below is the monthly time-series
Q123: TABLE 16-13
Given below is the monthly time-series
Q124: TABLE 16-12
A local store developed a multiplicative
Q125: TABLE 16-12
A local store developed a multiplicative
Q126: TABLE 16-13
Given below is the monthly time-series
Unlock this Answer For Free Now!
View this answer and more for free by performing one of the following actions

Scan the QR code to install the App and get 2 free unlocks

Unlock quizzes for free by uploading documents