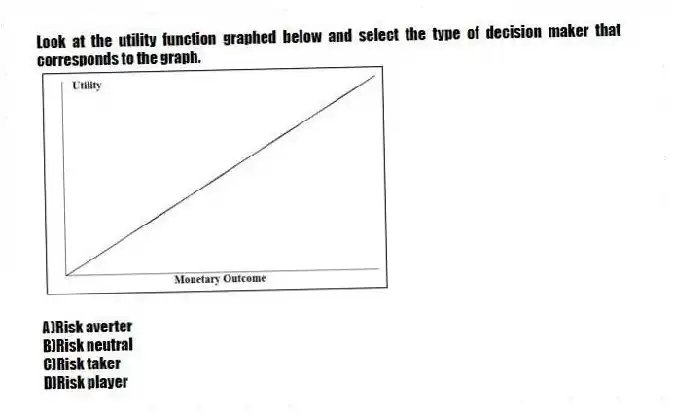
Look at the utility function graphed below and select the type of decision maker that corresponds to the graph. 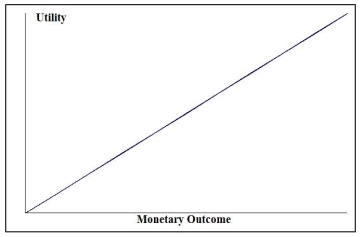
A) Risk averter
B) Risk neutral
C) Risk taker
D) Risk player
Correct Answer:
Verified
Q63: The risk seeker's curve represents the utility
Q64: Opportunity loss is the difference between the
Q65: At Eastern University,60% of the students are
Q71: In a local cellular phone area,company A
Q76: _ is a procedure for revising probabilities
Q77: The _ curve represents the expected monetary
Q98: The risk- _ curve represents the expected
Q283: TABLE 19-5
The following payoff table shows profits
Q290: TABLE 19-6
A student wanted to find out
Q298: TABLE 19-6
A student wanted to find out
Unlock this Answer For Free Now!
View this answer and more for free by performing one of the following actions

Scan the QR code to install the App and get 2 free unlocks

Unlock quizzes for free by uploading documents