A paired-difference experiment was conducted to compare two populations. The data are shown in the table. Use a sign test to determine whether the population distributions are different. 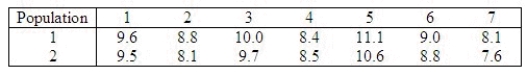 The null and alternate hypotheses are as follows:
  Determine an appropriate rejection region with
  0.01.
0.01.
Critical Values: ______________ Enter n1, n2
Calculate the observed value of the test statistic.
______________
Conclude: ______________
The data present ______________ evidence to indicate that populations 1 and 2 are different.
Correct Answer:
Verified
View Answer
Unlock this answer now
Get Access to more Verified Answers free of charge
Q121: A supermarket chain has its own house
Q122: Ten secretaries were selected at random from
Q123: Statistical tests that are not very sensitive
Q124: A nonparametric test is one that makes
Q125: The Mann-Whitney U test is a nonparametric
Q127: Nonparametric tests are often more efficient than
Q128: A dog kennel manager was interested in
Q129: Nonparametric tests are methods of inference that
Q130: It is important to sponsors of television
Q131: A parametric test is a hypothesis test
Unlock this Answer For Free Now!
View this answer and more for free by performing one of the following actions

Scan the QR code to install the App and get 2 free unlocks

Unlock quizzes for free by uploading documents