Solved

A Survey of 500 Respondents Produced These Cell Counts in a 2

Question 73

Short Answer

A survey of 500 respondents produced these cell counts in a 2 A survey of 500 respondents produced these cell counts in a 2   3 contingency table:   If you wish to test the null hypothesis of  independence  - that the probability that a response falls in any one row is independent of the column it falls in - and you plan to use a chi-square test, how many degrees of freedom will be associated with the   statistic? df = ______________ Compute   : = ______________ Reject   when   > ______________. Conclude that there ______________ reason to expect a dependence between rows and columns. Find the approximate p-value for the test. The p-value ______________ .10 3 contingency table: A survey of 500 respondents produced these cell counts in a 2   3 contingency table:   If you wish to test the null hypothesis of  independence  - that the probability that a response falls in any one row is independent of the column it falls in - and you plan to use a chi-square test, how many degrees of freedom will be associated with the   statistic? df = ______________ Compute   : = ______________ Reject   when   > ______________. Conclude that there ______________ reason to expect a dependence between rows and columns. Find the approximate p-value for the test. The p-value ______________ .10 
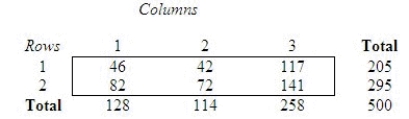
If you wish to test the null hypothesis of "independence" - that the probability that a response falls in any one row is independent of the column it falls in - and you plan to use a chi-square test, how many degrees of freedom will be associated with the A survey of 500 respondents produced these cell counts in a 2   3 contingency table:   If you wish to test the null hypothesis of  independence  - that the probability that a response falls in any one row is independent of the column it falls in - and you plan to use a chi-square test, how many degrees of freedom will be associated with the   statistic? df = ______________ Compute   : = ______________ Reject   when   > ______________. Conclude that there ______________ reason to expect a dependence between rows and columns. Find the approximate p-value for the test. The p-value ______________ .10 statistic?
df = ______________
Compute A survey of 500 respondents produced these cell counts in a 2   3 contingency table:   If you wish to test the null hypothesis of  independence  - that the probability that a response falls in any one row is independent of the column it falls in - and you plan to use a chi-square test, how many degrees of freedom will be associated with the   statistic? df = ______________ Compute   : = ______________ Reject   when   > ______________. Conclude that there ______________ reason to expect a dependence between rows and columns. Find the approximate p-value for the test. The p-value ______________ .10 : = ______________
Reject A survey of 500 respondents produced these cell counts in a 2   3 contingency table:   If you wish to test the null hypothesis of  independence  - that the probability that a response falls in any one row is independent of the column it falls in - and you plan to use a chi-square test, how many degrees of freedom will be associated with the   statistic? df = ______________ Compute   : = ______________ Reject   when   > ______________. Conclude that there ______________ reason to expect a dependence between rows and columns. Find the approximate p-value for the test. The p-value ______________ .10 when A survey of 500 respondents produced these cell counts in a 2   3 contingency table:   If you wish to test the null hypothesis of  independence  - that the probability that a response falls in any one row is independent of the column it falls in - and you plan to use a chi-square test, how many degrees of freedom will be associated with the   statistic? df = ______________ Compute   : = ______________ Reject   when   > ______________. Conclude that there ______________ reason to expect a dependence between rows and columns. Find the approximate p-value for the test. The p-value ______________ .10 > ______________.
Conclude that there ______________ reason to expect a dependence between rows and columns.
Find the approximate p-value for the test.
The p-value ______________ .10

Correct Answer:

verifed

Verified

2; 4.1879;...

View Answer

Unlock this answer now
Get Access to more Verified Answers free of charge

Related Questions

Unlock this Answer For Free Now!

View this answer and more for free by performing one of the following actions

qr-code

Scan the QR code to install the App and get 2 free unlocks

upload documents

Unlock quizzes for free by uploading documents