A university admissions committee was interested in examining the relationship between a student's score on the SAT exam, x, and the student's grade point average, y, (GPA) at the end the student's freshman year of college. The committee selected a random sample of 25 students and recorded the SAT score and GPA at the end of the freshman year of college for each student. Use the following output that was generated using Minitab to answer the questions below: 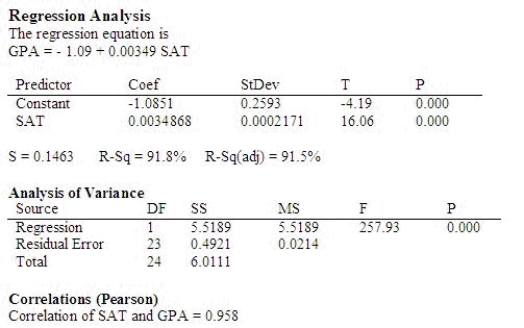 Determine the correlation between a student's SAT score and GPA at the end of the freshman year.
Since b is ______________ the correlation is ______________.
Interpret the value.
There is a ______________ linear relationship between a student's SAT score and GPA at the end of the freshman year.
Correct Answer:
Verified
View Answer
Unlock this answer now
Get Access to more Verified Answers free of charge
Q36: The following are coefficients of correlation (r).
Q37: In developing a 95% confidence interval for
Q38: In order to predict with 95% confidence
Q39: In publishing the results of some research
Q40: In simple linear regression, the plot of
Q42: A microwave manufacturer has collected the data
Q43: Six points have these coordinates: 
Q44: The manager of an ice cream store
Q45: If a sample of 25 observations is
Q46: In order to predict with 98% confidence
Unlock this Answer For Free Now!
View this answer and more for free by performing one of the following actions

Scan the QR code to install the App and get 2 free unlocks

Unlock quizzes for free by uploading documents