A food processor wants to compare two preservatives for their effects on retarding spoilage. Suppose 16 cuts of fresh meat are treated with preservative A and 16 are treated with preservative B, and the number of hours until spoilage begins is recorded for each of the 32 cuts of meat. The results are summarized in the table below: 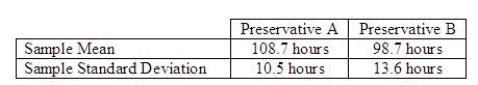 Calculate the value of the test statistic for testing the equality of the population variances, and write the proper conclusion for
  = 0.05.
Test statistic = ______________
Critical Value(s) = ______________
Conclusion: ______________
Interpretation: __________________________________________
Develop the 95% confidence interval estimate of the ratio of the two population variances.
______________
Correct Answer:
Verified
View Answer
Unlock this answer now
Get Access to more Verified Answers free of charge
Q48: For a given level of significance, increasing
Q49: The area under a chi-squared curve with
Q50: Independent random samples from two normal populations
Q51: If you wish to test 
Q52: The area to the right of a
Q54: A statistician wants to test for the
Q55: A right-tailed area in the chi-squared distribution
Q56: The 5th percentile of a chi-squared distribution
Q57: The chi-squared critical value Q58: The printing time of a weekly magazine![]()
Unlock this Answer For Free Now!
View this answer and more for free by performing one of the following actions

Scan the QR code to install the App and get 2 free unlocks

Unlock quizzes for free by uploading documents