Male and female respondents to a questionnaire about gender differences are categorized into three groups according to their answers as shown below: 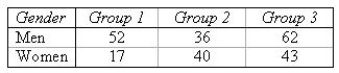 Create a side-by-side bar chart to describe these data.
Create two pie charts (one for men and one for women) to describe these data.
Men:
Women:
Which of the charts created above best depicts the difference or similarity of the responses of men and women.
______________
Correct Answer:
Verified
Q25: Which value of the correlation coefficient r
Q26: When the price of gasoline gets high,
Q27: In constructing a scatterplot, it would not
Q28: A scatterplot can be used to determine
Q29: The manager of a movie rental store
Q30: The best-fitting regression line can be used
Unlock this Answer For Free Now!
View this answer and more for free by performing one of the following actions

Scan the QR code to install the App and get 2 free unlocks

Unlock quizzes for free by uploading documents