Thirty-three students were asked to rate themselves on whether they were outgoing or not using this five point scale: 1 = extremely extroverted, 2 = extroverted, 3 = neither extroverted nor introverted, 4 = introverted, or 5 = extremely introverted. The results are shown in the table below: 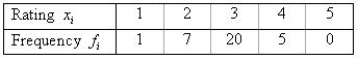
a. Find the percentage of measurements in the following intervals:
 = ______________
 = ______________
This interval contains approximately ______________% of the data.
 = ______________
 = ______________
This interval contains approximately ______________% of the data.
b. Comment on the shape of the distribution.
____________________________
Correct Answer:
Verified
View Answer
Unlock this answer now
Get Access to more Verified Answers free of charge
Q63: A college placement office conducted a survey
Q64: From a sample of size 100, the
Q65: Whenever a statistical population can be described,
Q66: When a machine dispensing cola at a

Unlock this Answer For Free Now!
View this answer and more for free by performing one of the following actions

Scan the QR code to install the App and get 2 free unlocks

Unlock quizzes for free by uploading documents