As an automobile ages, gas mileage typically decreases, and it decreases at an increasing rate. Which graph best represents this?
A) 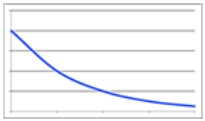
B) 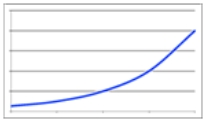
C) 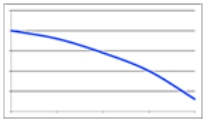
D) 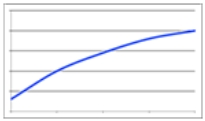
Correct Answer:
Verified
Q43: The population of the United States is
Q44: If inflation from year 1 to year
Q45: This figure is an example of a:
Q46: Data that depend upon the value of
Q47: According to a report, the percentage of
Q49: If inflation from year 1 to year
Q50: Any graph can be misleading if _
Q51: It is not important to know whether
Q52: In cleaning toxic waste sites, typically the
Q53: Suppose we have some money in a
Unlock this Answer For Free Now!
View this answer and more for free by performing one of the following actions

Scan the QR code to install the App and get 2 free unlocks

Unlock quizzes for free by uploading documents