The Venn diagram shows the results of a survey asking registered voters if they would vote for proposition A or proposition B: 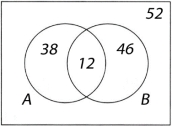 How many surveyed would vote for only proposition B?
A) 12
B) 58
C) 52
D) 46
Correct Answer:
Verified
Q41: Suppose set M is mathematics majors and
Q42: Suppose that 100 students were given a
Q43: If a car drives 11 kilometers per
Q44: A dollar bill is 6.14 inches long,
Q45: For charity, a school collects 10 million
Q47: One kilobyte of memory can store about
Q48: A group of students were surveyed to
Q49: A group of students were surveyed to
Q50: A group of students were surveyed to
Q51: The Venn diagram shows the results of
Unlock this Answer For Free Now!
View this answer and more for free by performing one of the following actions

Scan the QR code to install the App and get 2 free unlocks

Unlock quizzes for free by uploading documents