The Venn diagram shows the results of a survey asking registered voters if they would vote for proposition A or proposition B: 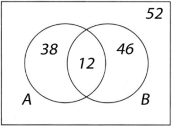 To get approved, a proposition must get at least 40% of the total votes. List the approved propositions.
A) None
B) A
C) B
D) A and B
Correct Answer:
Verified
Q54: Light travels at 186,000 miles per second.
Q55: Suppose set M is mathematics majors and
Q56: A terabyte is _ megabytes.
A)1000
B)1 million
C)1 billion
D)1
Q57: There are 1000 billions in a trillion.
Q58: Suppose A is the set of even
Q60: A group of students were surveyed to
Q61: You are going on a 957-mile trip
Q62: If you had $1 million in $10
Q63: The number of blogs has grown rapidly.
Q64: It has been projected that the world's
Unlock this Answer For Free Now!
View this answer and more for free by performing one of the following actions

Scan the QR code to install the App and get 2 free unlocks

Unlock quizzes for free by uploading documents