Essay
Figure: The Optimal Quantity
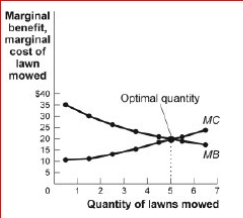
 (Figure: The Optimal Quantity) Look at the figure The Optimal Quantity.If the demand for
lawn-mowing increased, the ________ curve in the figure would shift to the and the
optimal quantity would be five lawns mowed.
A.marginal benefit; right; more than
B.marginal cost; right; fewer than
C.marginal benefit; left; fewer than
D.marginal cost; left; more than
Correct Answer:
Verified
marginal b...
View Answer
Unlock this answer now
Get Access to more Verified Answers free of charge
Related Questions
Q115: Figure: The Optimal Quantity Q116: Use the following to answer questions:
![]()

