Figure: The Market for Round-Trip Airline Flights
 (Figure: The Market for Round-Trip Airline Flights) Look at the figure The Market for
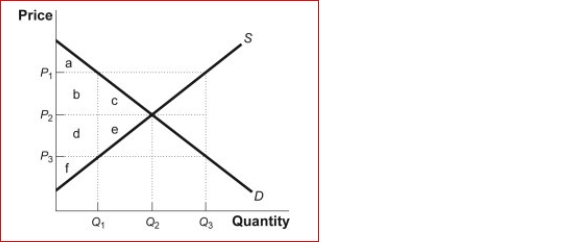
Round-Trip Airline Flights.The supply and demand graph represents the market for round-trip airline flights between Boston and New York.Suppose the mayor of New York decides to limit the number of flights to Q₁ to reduce air pollution.What area or areas represent deadweight loss after the quota is in place?
A.A
B.a + b + c
C.c + e
D.b + d + f
Correct Answer:
Verified
Q131: The quota rent refers to:
A.the difference between
Q132: If the government imposes a limit on
Q133: If a quota is set above the
Q134: Quota limits cause:
A.the demand price to be
Q135: Table: The Market for Taxi Rides
(Table: Market
Q135: The difference between the demand price and
Q137: Figure: The Market for Clams

Q138: Table: The Market for Taxi Rides
(Table: The
Q139: Suppose the United States removes the current
Q141: Figure: The Shrimp Market
![]()
Unlock this Answer For Free Now!
View this answer and more for free by performing one of the following actions

Scan the QR code to install the App and get 2 free unlocks

Unlock quizzes for free by uploading documents