Figure: Demand and Supply of Gasoline
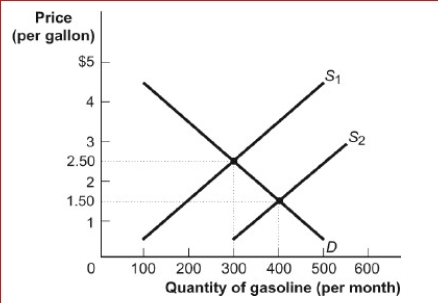
 (Figure: Demand and Supply of Gasoline) Look at the figure Demand and Supply of Gasoline.When the supply curve shifted from the initial equilibrium, the new intersection of supply and demand has a price of and quantity of 400.This supply shift could have resulted from
________.
A.$1.50; an increase in consumers' income
B.$1.50; an increase in refining technology
C.$2.00; an increase in the number of buyers
D.$2.00; an increase in consumers' income
Correct Answer:
Verified
View Answer
Unlock this answer now
Get Access to more Verified Answers free of charge
Q81: What is the difference between a shortage
Q82: Figure: Demand and Supply of Gasoline
Q83: Figure: Demand and Supply of Gasoline
(Figure: Demand
Q83: Use the following to answer questions :
Q86: If the quantity supplied in a market
Q87: Figure: Demand and Supply of Gasoline
(Figure: Demand
Q101: If the supply and demand curves intersect
Q103: Suppose the equilibrium price of good Y
Q105: Suppose the equilibrium price of good X
Q110: If the supply and demand curves intersect
Unlock this Answer For Free Now!
View this answer and more for free by performing one of the following actions

Scan the QR code to install the App and get 2 free unlocks

Unlock quizzes for free by uploading documents