Figure: Hot Drinks Sold and Temperature
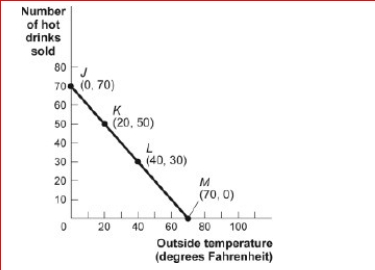
 (Figure: Hot Drinks Sold and Temperature) Look at the figure Hot Drinks Sold and Temperature.If we move from point K to point L in the figure, the outside temperature has and the
number of hot drinks sold has _.
A.decreased by 30 degrees; increased by 30 drinks
B.increased by 20 degrees; decreased by 20 drinks
C.increased by 30 degrees; decreased by 30 drinks
D.increased by 40 degrees; decreased by 40 drinks
Correct Answer:
Verified
View Answer
Unlock this answer now
Get Access to more Verified Answers free of charge
Q7: If two variables are negatively related:
A)as one
Q11: The _ of a curve shows the
Q13: Figure: Good X and Good Y
Q14: (Table: Hours Studied and Quiz Score) Look
Q15: Figure: Demand and Supply of Shirts
Q18: The relationship between two variables that move
Q19: Figure: Cold Drinks Sold and Temperature
Q20: When graphing a curve, the vertical intercept
Q21: Figure: Demand and Supply
(Figure: Demand and Supply)
Q22: Figure: Illustrating Slope
![]()
Unlock this Answer For Free Now!
View this answer and more for free by performing one of the following actions

Scan the QR code to install the App and get 2 free unlocks

Unlock quizzes for free by uploading documents