Figure: Illustrating Slope
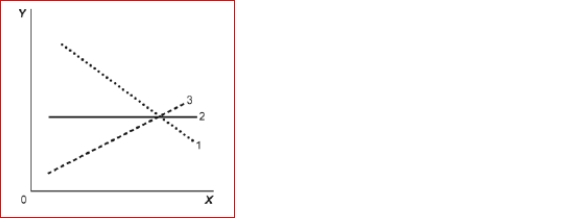 (Figure: Illustrating Slope) Look at the figure Illustrating Slope.In the graph, line 1 depicts X and
Y to be:
A.positively related.
B.nonlinearly related.
C.unrelated.
D.negatively related.
Correct Answer:
Verified
Q27: Use the following to answer questions:
Q27: The slope of a straight line is
Q28: Figure: Illustrating Slope Q32: Two points on a nonlinear curve have Q32: Figure: Slope Q33: Figure: Demand and Supply Q34: Figure: Demand and Supply of Shirts Q35: Figure: Demand and Supply Q36: The ratio of the change in the Q36: (Table: Wages and Hours Worked) Look at Unlock this Answer For Free Now! View this answer and more for free by performing one of the following actions Scan the QR code to install the App and get 2 free unlocks Unlock quizzes for free by uploading documents![]()
![]()
![]()
![]()

