Figure: Unemployment Rate over Time
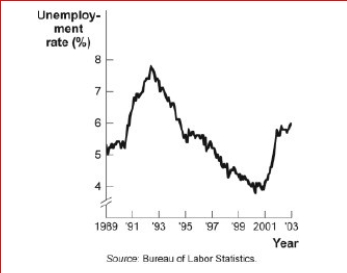
 (Figure: Unemployment Rate over Time) Look again at the figure Unemployment Rate over Time.In the time-series graph, as we move from 1993 to 1995, we see that the unemployment rate has:
A.decreased from approximately 5% to approximately
B.4%.increased from approximately 5.3% to approximately 7.3%.
C.decreased from approximately 7% to approximately 5.5%.
D.increased from approximately 4% to approximately 6.3%.
Correct Answer:
Verified
View Answer
Unlock this answer now
Get Access to more Verified Answers free of charge
Q50: The fact that two variables always move
Q53: A positive relationship between swimsuits purchased and
Q54: Professor Macro wants to use a numerical
Q55: Figure: Labor Force Participation Rate

Q56: The owner of the Dismal Philosopher, one
Q57: Taylor sees a bar graph showing the
Q58: (Table: Price, Quantity Demanded, and Quantity Supplied)
Q59: If a supply curve is represented by
Q60: Figure: Seasonally Adjusted Unemployment Rate
(Figure: Seasonally Adjusted
Q61: The scaling of the axes of a
Unlock this Answer For Free Now!
View this answer and more for free by performing one of the following actions

Scan the QR code to install the App and get 2 free unlocks

Unlock quizzes for free by uploading documents