Figure: Market Failure 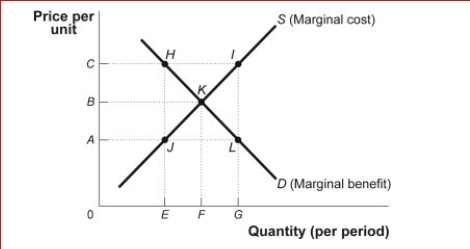
 (Figure: Market Failure) Look at the figure Market Failure.Suppose the supply curve represents the marginal cost of providing street lights in a neighborhood that is composed of two people, Ann and Joe.The demand curve represents the marginal benefit that Ann receives from the street lights.Suppose that Joe's marginal benefit from the street lights is a constant amount equal to AC.How much is Ann willing to pay for E street lights?
A) 0
B) A
C) B
D) C
Correct Answer:
Verified
Q157: The marginal cost of producing an artificially
Q158: Figure: Demand and Marginal Revenue 
Q159: The source of the inefficient use of
Q160: Figure: Demand and Marginal Revenue
Q161: Figure: Market Failure Q163: Figure: Market Failure Q164: Figure: Market Failure Q165: Figure: Market Failure Q166: Figure: Market Failure Q167: Figure: Market Failure Unlock this Answer For Free Now! View this answer and more for free by performing one of the following actions Scan the QR code to install the App and get 2 free unlocks Unlock quizzes for free by uploading documents![]()
(Figure: Market Failure) In the![]()
(Figure: Market Failure) Look at![]()
![]()

