Figure: Market Failure 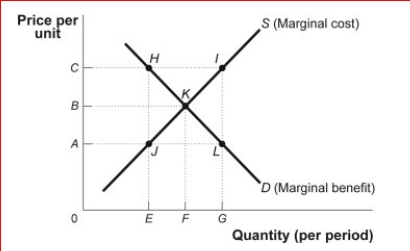
 (Figure: Market Failure) Look at the figure Market Failure.Suppose the supply curve represents the marginal cost of providing street lights in a neighborhood that is composed of two people, Ann and Joe.The demand curve represents the marginal benefit that Ann receives from the street lights.Suppose that Joe's marginal benefit from the street lights is a constant amount equal to AC.The market would provide street lights.The efficient
Quantity of street lights is _.
A) 0; F
B) F; F
C) E; F
D) F; G
Correct Answer:
Verified
Q170: Figure: Market Failure Q171: Figure: Market Failure Q172: Figure: Market Failure Q173: Figure: Market Failure Q174: Figure: Market Failure Q176: Figure: Market Failure Q177: Figure: Market Failure Q178: Figure: Market Failure Q179: Figure: Market Failure Q180: Figure: Market Failure Unlock this Answer For Free Now! View this answer and more for free by performing one of the following actions Scan the QR code to install the App and get 2 free unlocks Unlock quizzes for free by uploading documents![]()
![]()
![]()
![]()
![]()
(Figure: Market Failure) Look at
(Figure: Market Failure) Look at
(Figure: Market Failure) Look at![]()
(Figure: Market Failure) Look at

