Figure: Monopoly Profits in Duopoly 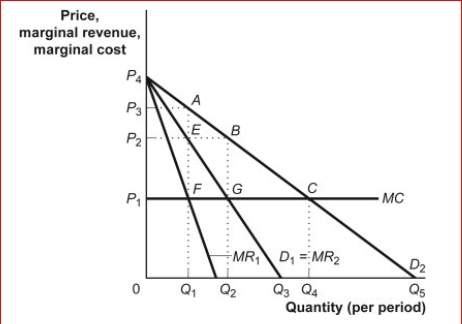
 (Figure: Monopoly Profits in Duopoly) The figure Monopoly Profits in Duopoly illustrates the situation in which an industry consisting of two firms that face identical demand curves (D1) can collude to increase profits.If the firms collude and agree to share the market demand equally, then each firm will act as if its demand curve is given by:
A) D1.
B) D2.
C) MR1.
D) 2 × D1.
Correct Answer:
Verified
Q33: If there are two gas stations in
Q39: The Herfindahl-Hirschman index equals _ when _
Q40: In an oligopolistic market structure, collusion between
Q41: Figure: Monopoly Profits in Duopoly 
Q42: Figure: Monopoly Profits in Duopoly
Q44: (Table: Demand Schedule for Gadgets) Look at
Q45: Figure: Monopoly Profits in Duopoly
(Figure: Monopoly Profits
Q46: (Table: Demand Schedule for Gadgets) Look at
Q47: (Table: Demand Schedule for Gadgets) Look at
Q48: (Table: Demand Schedule for Gadgets) Look at
Unlock this Answer For Free Now!
View this answer and more for free by performing one of the following actions

Scan the QR code to install the App and get 2 free unlocks

Unlock quizzes for free by uploading documents