Figure: Monopoly Profits in Duopoly 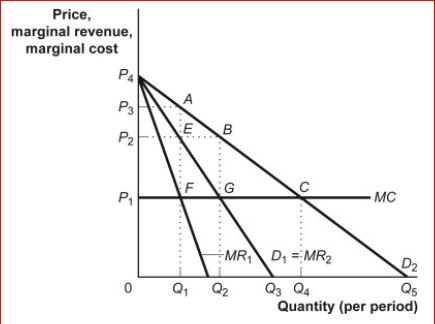
 (Figure: Monopoly Profits in Duopoly) The figure Monopoly Profits in Duopoly illustrates the situation in which an industry consisting two firms that face identical demand curves (D1) can collude to increase profits.If the firms collude and agree to share the market demand equally, then each firm will act as if its demand curve is given by , while the market demand
Curve is given by _.
A) D1; MR2
B) D2; D1
C) D1; D2
D) MR1; MR2
Correct Answer:
Verified
Q49: Q50: Figure: Monopoly Profits in Duopoly Q51: (Table: Demand Schedule for Gadgets) Look at Q52: Figure: Monopoly Profits in Duopoly Q53: (Table: Demand Schedules of Gadgets) Look at Q55: Figure: Monopoly Profits in Duopoly Q56: Figure: Collusion (Figure: Collusion) In the figure Q57: (Table: Demand Schedule for Gadgets) Look at Q58: Figure: Monopoly Profits in Duopoly Q59: Figure: Monopoly Profits in Duopoly ![]()

(Figure: Monopoly Profits
Unlock this Answer For Free Now!
View this answer and more for free by performing one of the following actions

Scan the QR code to install the App and get 2 free unlocks

Unlock quizzes for free by uploading documents