Figure: Collusion 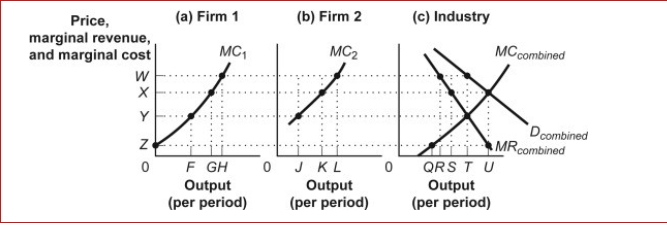
 (Figure: Collusion) In the figure Collusion, panel (c) gives the combined marginal revenue, demand, and marginal cost curves for an industry containing several firms.Panels (a) and (b) give marginal cost curves for two of those firms.The quantity of output produced by the industry with collusion is shown by:
A) Q.
B) R.
C) S.
D) T.
Correct Answer:
Verified
Q55: Figure: Monopoly Profits in Duopoly 
Q56: Figure: Collusion (Figure: Collusion) In the figure
Q57: (Table: Demand Schedule for Gadgets) Look at
Q58: Figure: Monopoly Profits in Duopoly
Q59: Figure: Monopoly Profits in Duopoly
Q61: (Table: Demand for Crude Oil) Look at
Q62: An analytical approach through which strategic choices
Q63: (Table: Demand for Crude Oil) Look at
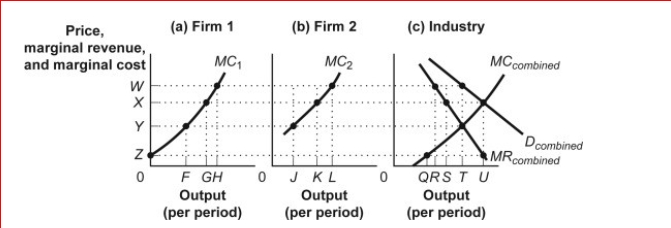
Q64: Figure: Collusion (Figure: Collusion) In the figure
Q65: (Table: Demand for Crude Oil) The table
Unlock this Answer For Free Now!
View this answer and more for free by performing one of the following actions

Scan the QR code to install the App and get 2 free unlocks

Unlock quizzes for free by uploading documents