Figure: Demand, Revenue, and Cost Curves
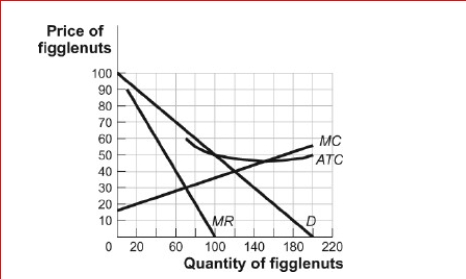
 (Figure: Demand, Revenue, and Cost Curves) Look at the figure Demand, Revenue, and Cost Curves.The figure shows the demand, marginal revenue, marginal cost, and average total cost curves for Figglenuts-R-Us, a monopolist in the figglenut market.If the government regulated the figglenut market by setting a price ceiling of $40, Figglenuts-R-Us might:
A.produce 60 figglenuts to maximize profit.
B.produce 120 figglenuts to maximize profit.
C.shut down in the short run.
D.increase the price to $60.
Correct Answer:
Verified
View Answer
Unlock this answer now
Get Access to more Verified Answers free of charge
Q116: Suppose GoSports pennant monopoly is broken up
Q117: Figure: Computing Monopoly Profit
(Figure: Computing Monopoly Profit)
Q118: Figure: Computing Monopoly Profit
(Figure: Computing Monopoly Profit)
Q119: In monopoly:
A.a basic condition for efficiency is
Q120: If a monopoly is producing at the
Q122: If a monopoly is forced to charge
Q124: _ is the practice of selling at
Q125: In order to engage in price discrimination
Q145: In an industry characterized by extensive economies
Q152: Price discrimination is the practice of:
A)charging different
Unlock this Answer For Free Now!
View this answer and more for free by performing one of the following actions

Scan the QR code to install the App and get 2 free unlocks

Unlock quizzes for free by uploading documents