Figure: Cost Curves for Corn Producers
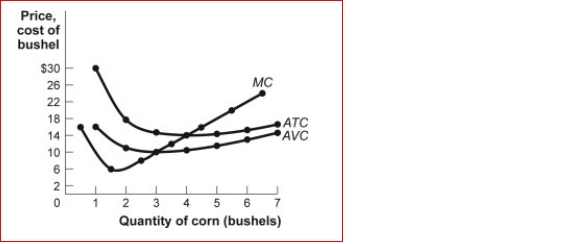 (Figure: Cost Curves for Corn Producers) Look at the figure Cost Curves for Corn Producers.(Figure: Cost Curves for Corn Producers)The market for corn is perfectly competitive, and an individual corn farmer faces the cost curves shown in the figure.If the price of a bushel of corn in the market is $10, then the farmer will produce of corn and experience an
economic ________ equal to _.
A.0 bushels; loss; average fixed costs
B.0 bushels; loss; total variable costs
C.3 bushels; loss; total fixed costs
D.3 bushels, loss; $22 per bushel
Correct Answer:
Verified
View Answer
Unlock this answer now
Get Access to more Verified Answers free of charge
Q107: A perfectly competitive firm will incur an
Q115: Figure: Cost Curves for Corn Producers
Q116: Figure: Cost Curves for Corn Producers
Q117: Which of the following is true?
A.If the
Q118: Figure: Prices, Cost Curves, and Profits
(Figure: Prices,
Q120: Wenqin is a farmer, and in the
Q121: Figure: The Marginal Decision Rule

Q122: Figure: Revenues, Costs, and Profits III for
Q123: Figure: Revenues, Costs, and Profits III for
Q124: Figure: Revenues, Costs, and Profits III for
Unlock this Answer For Free Now!
View this answer and more for free by performing one of the following actions

Scan the QR code to install the App and get 2 free unlocks

Unlock quizzes for free by uploading documents