Figure: The Profit Maximizing Firm
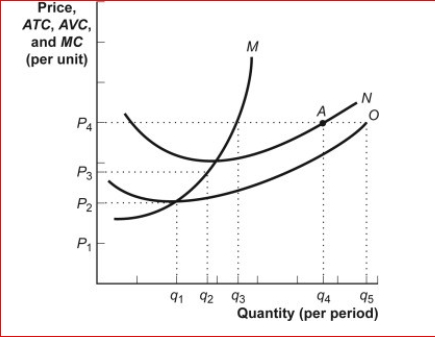
 (Figure: The Profit Maximizing Firm) Look at the figure The Profit Maximizing Firm.The figure shows cost curves for a firm operating in a perfectly competitive market.At Q₂, ATC is the vertical distance between Q₂ on the horizontal axis and:
A.curve M.
B.curve N.
C.curve O.
D.P₄.
Correct Answer:
Verified
Q152: Figure: A Perfectly Competitive Firm in the
Q153: Figure: The Profit Maximizing Firm

Q154: Figure: A Perfectly Competitive Firm in the
Q155: Figure: The Profit Maximizing Firm
(Figure: The Profit
Q156: Figure: The Profit Maximizing Firm
Q158: (Table: Soybean Cost) Look at the table
Q159: Figure: A Perfectly Competitive Firm in the
Q160: (Table: Soybean Cost) Look at the table
Q161: The supply curve found by summing up
Q162: The short-run industry supply curve:
A.shows the total
Unlock this Answer For Free Now!
View this answer and more for free by performing one of the following actions

Scan the QR code to install the App and get 2 free unlocks

Unlock quizzes for free by uploading documents